Reports and Dashboard with Full Traceability
Beautiful, actionable test reports with screenshots, Playwright traces, and trend charts. Track test health over time from a real-time dashboard built for teams.
How Reports and Dashboard Work
Every time a test runs in CFTR — whether triggered manually, on a schedule, or through an agent — a comprehensive report is generated automatically. The report captures every step of the test execution, including screenshots on failure, browser console logs, and a full Playwright trace file.
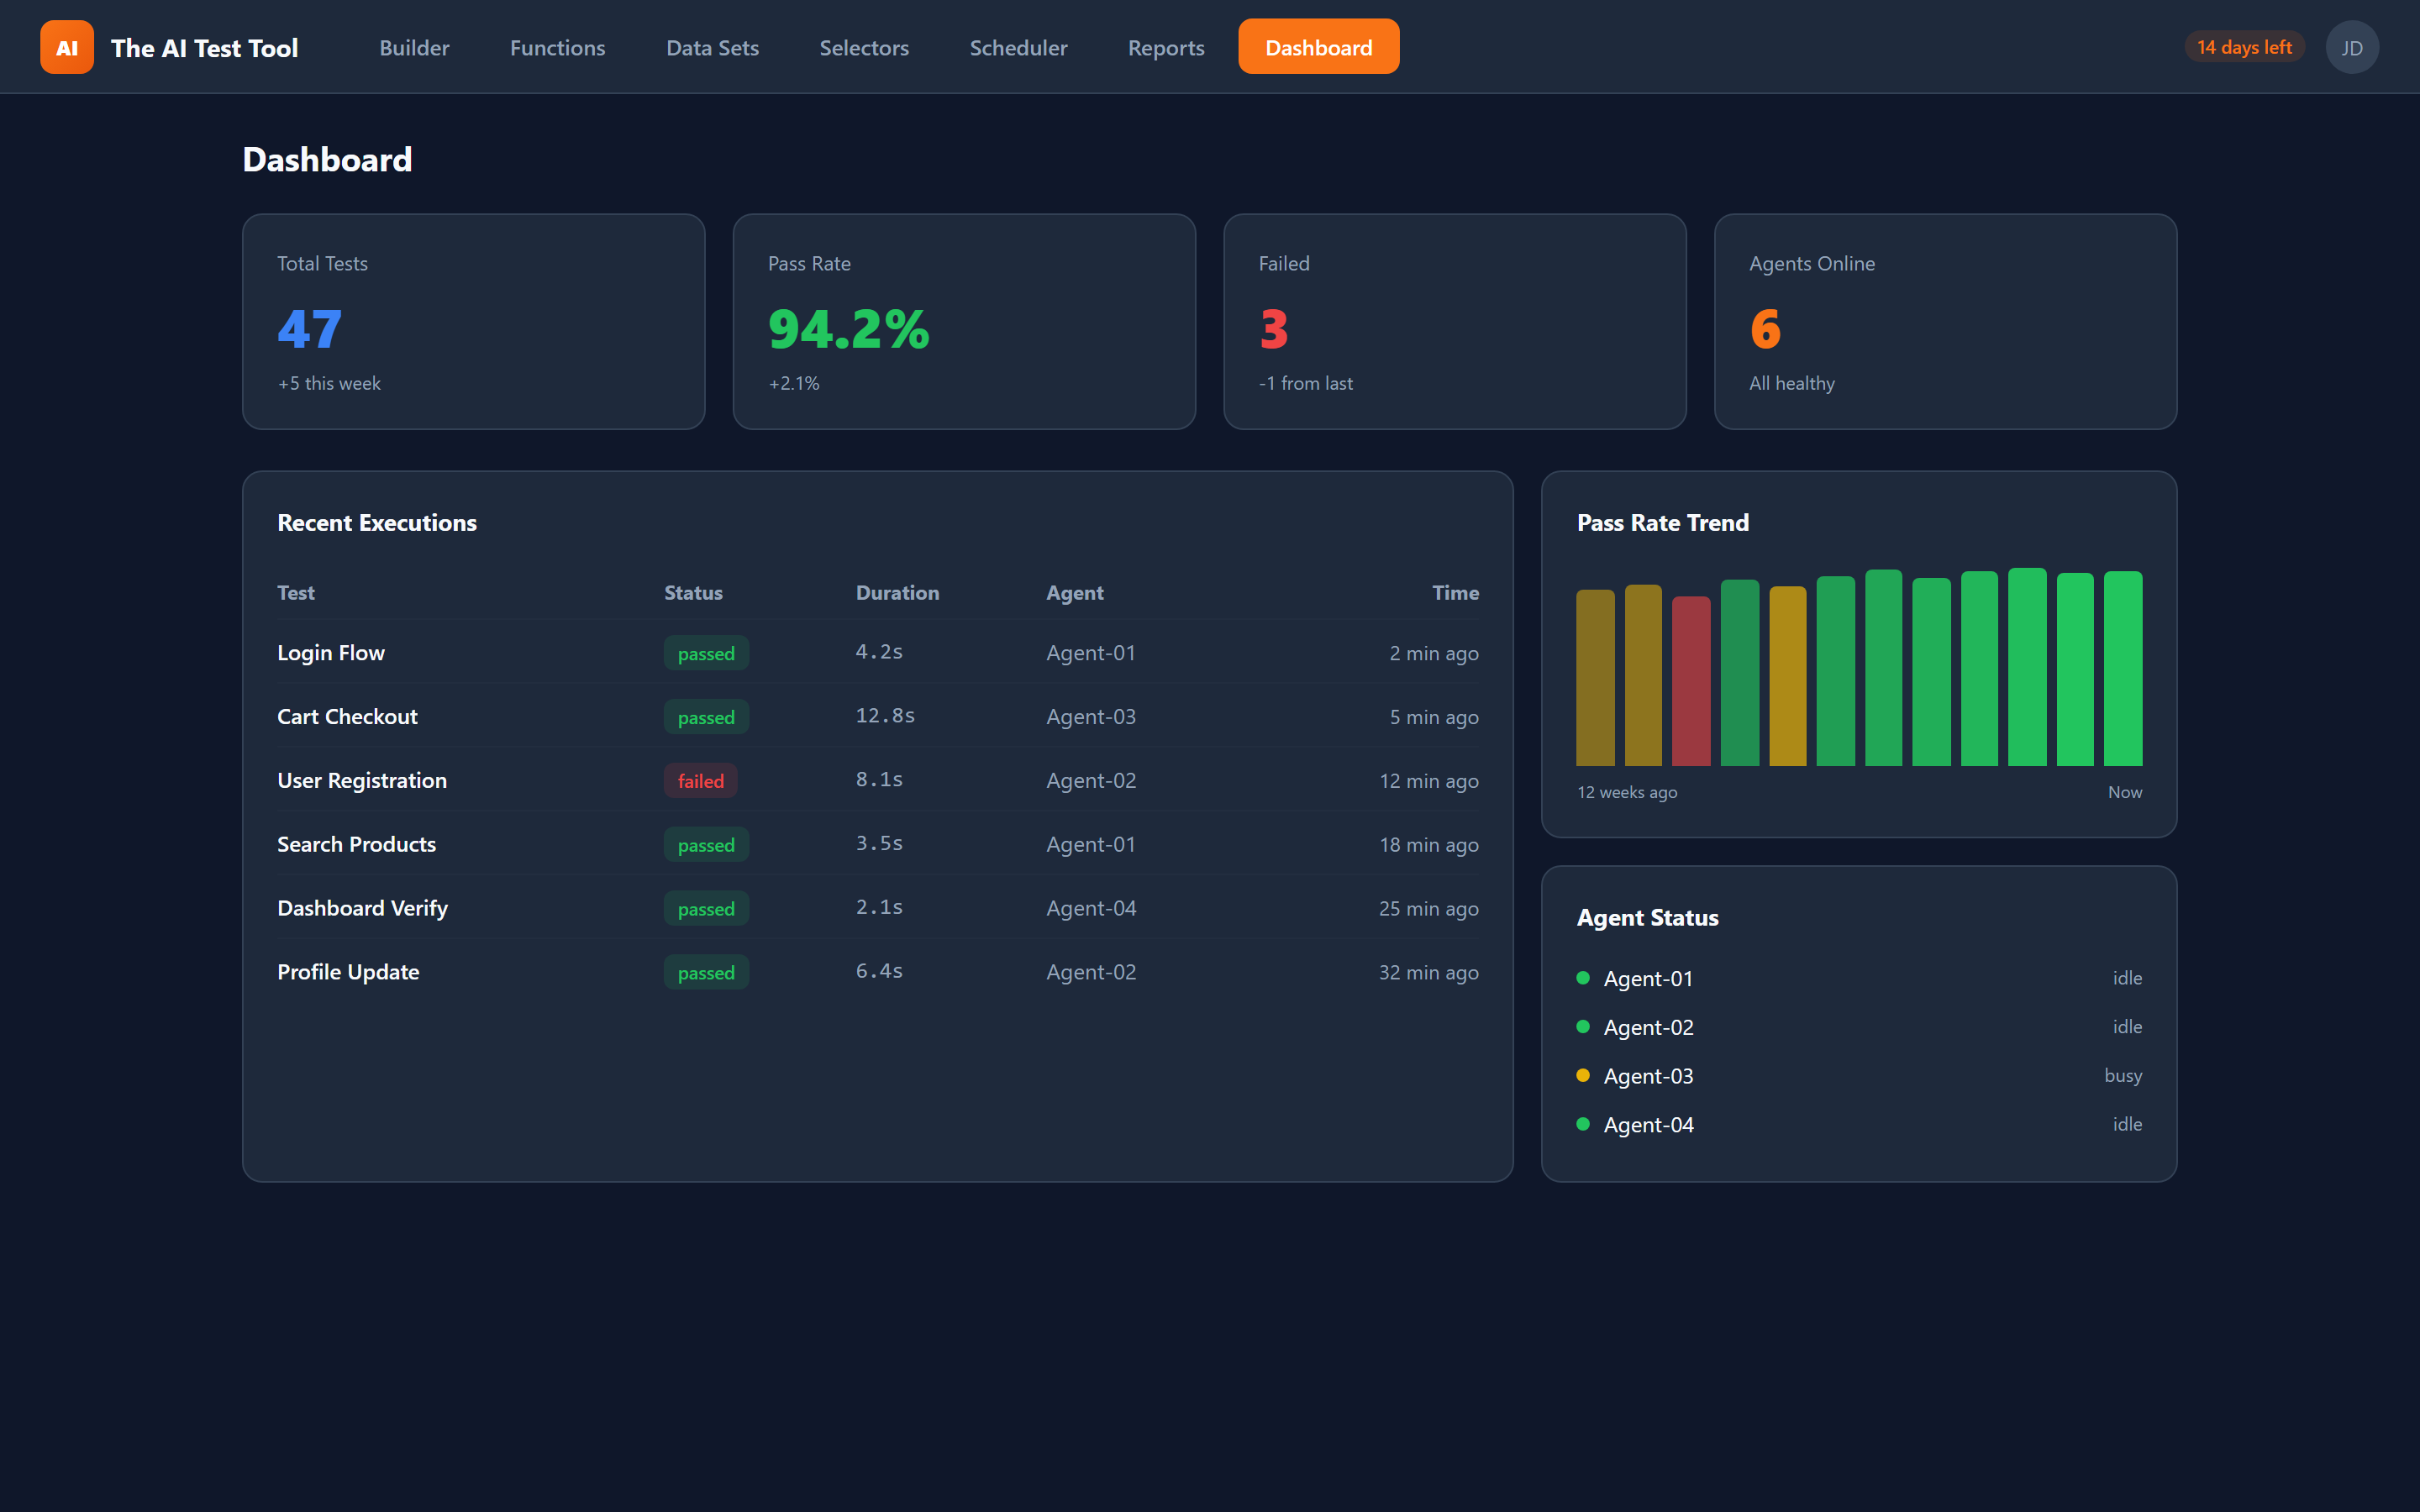
Reports are stored and accessible from the dashboard, which aggregates results across all your projects. The dashboard displays KPI cards for a quick health snapshot and trend charts that plot pass/fail rates over time. You can drill down from the dashboard into any individual test run to see exactly what happened.
To keep storage manageable, CFTR automatically cleans up old reports and retains the last 50 per account. Each report includes an HTML summary and a Playwright trace file, giving you both a human-readable overview and a powerful debugging tool in one package.
Key Capabilities
From high-level KPIs to step-level trace files, CFTR reports give you the right level of detail for every audience.
Built for Visibility and Debugging
Whether you need a quick pass/fail overview or a frame-by-frame trace of a failing test, the dashboard and reports have you covered.
Real-Time Dashboard
The CFTR dashboard updates in real time as test runs complete. KPI cards at the top give you an instant health overview — total runs, pass rate, average duration, and failure count. Below the KPIs, trend charts plot your test health over days and weeks so you can spot regressions before they compound.
Full Traceability
Every test run generates a detailed report with step-by-step execution logs. Each step shows its status, duration, and any error messages. Failed steps include a screenshot of the browser at the moment of failure plus a Playwright trace file you can open in the Trace Viewer for frame-by-frame debugging.
Filtering and Search
As your test suite grows, finding specific results matters. Filter reports by project, status (passed, failed, skipped), date range, or custom tags. Quickly isolate failing tests to understand patterns — is one project consistently failing, or did a recent deployment break a specific flow?
Share and Export
Generate shareable HTML reports that anyone can open in a browser without needing a CFTR account. Share direct links to specific test runs with your development team, product managers, or stakeholders. Export filtered results for inclusion in sprint retrospectives or compliance documentation.
From Failure to Fix in Minutes
A scheduled nightly test run fails at 3 AM. When the team arrives in the morning, the dashboard immediately shows which tests failed and when. The KPI cards highlight a drop in pass rate, and the trend chart confirms it started with last night's run.
Clicking into the failing test reveals a step-by-step execution log. Step 7 — clicking the checkout button — failed with a timeout. The screenshot shows a loading spinner that never resolved. Opening the Playwright trace in the Trace Viewer shows a network request to the payment API that returned a 503 error.
The engineer shares the report link with the backend team, who immediately see the failing request in the trace. The root cause is identified and fixed before the morning standup. Without traceability, this would have been a multi-hour investigation starting from "some tests failed last night."